Understanding useful pieces of information from raw and bulk data requires a lot of time, effort, and patience. But, if the same raw and bulk data is represented visually, it becomes much more simple, easy, and less time-consuming to understand the information.
Boring raw data can be visually represented through various types of contents such as charts, graphs, presentations, infographics, and many other visual contents. This method of representing a set of data through different types of visual content is known as Data Visualization.
Irrespective of industry or business, Data visualization is touching the peak of success at this moment. It not only makes a set of data interesting, attractive, and easy-to-understand but also offers many other important benefits to businesses.
Data visualization tools help businesses to grow and achieve success in various ways such as helping them to take more effective action, better communication, better discussion, keep a steady track, keep up with trends, and link better between their operations and results. Therefore, businesses prefer data visualization methods and techniques rather than writing the same data in blocks of paragraphs.
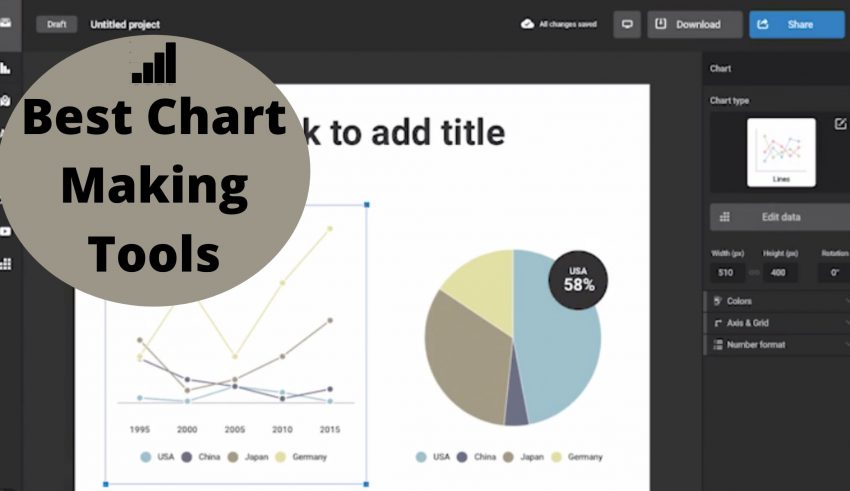
When it comes to data visualization, charting tools are the most used and most important tools as they are required everywhere for all kinds of needs. You can also get the best chart making ideas and create great charts for your needs with the help of chart-making tools available in the market. But there are hundreds of charting tools and, selecting the best tool for your business may be a tough, challenging, and time-consuming task.
So, to help you out we’ve searched through the internet, read reviews, analyzed different chart-making tools, and finally sorted out the 10 best chart-making tools that will help you create the best charts.
Here are the Best Chart Making Tools:
Visme
Visme is the best and #1 all-in-one cloud-based visual communication tool. From creating beautiful and engaging presentations to social media graphics, you can rely on Visme for creating any kind of content. You can create all forms of visuals content such as Presentations, Infographics, Charts, Graphs, Documents, Printables, Graphics, and a lot more.
Visme turns simple brand visuals into fully interactive content and, therefore, it is trusted by over 6+ million users in over 100+ countries all over the world. It is also used and trusted by leading brands such as IBM, Unilever, Zurich, Penske, and many more.
Features:
- It offers users with facilities such as 1000+ easy-to-use pre-designed templates, 1000+ icons, Millions of images, 50+ Charts, Maps, and Data widgets. It also allows users to add audio, video, or embed anything in their content.
- Users can share their content in any format such as share online, privately, or download content.
- It allows users to access their content anytime and anywhere and also collaborate effectively.
- It also offers video tutorials, live webinars, blogs, ebooks, and many other learning materials.
Pricing:
- Free: plan offers free sign-up and free access to limited tools for an unlimited period.
- Standard: at $25/ month when billed annually.
- Business: at $49/ month when billed annually.
- Enterprise: custom pricing as one can directly contact to get a personalized quote.
Lucidchart
Lucidchard is one of the best chart-making tools that help businesses to make better decisions by enabling them to create powerful visuals. Anyone irrespective of their industry and role can go for Lucidchart as it is the all-in-one intelligent diagramming software.
Creating visuals for your business becomes very easy with the help of this tool as you can choose either from over 500 templates available on the platform or can customize your diagram.
It facilitates diagramming, flowcharting, software, system designs, process mapping, chart design, agile planning, and many more. It is also preferred by 99% of the Fortune 500 companies.
Features:
- Users can create a diagram from data by importing data or by using an automated layout. It also provides an actionable view of diagrams and data to the users.
- It offers users to get everyone on the same page, collaborate, and work together through its real-time collaboration.
- It offers users easy integration with all the major leading platforms.
- It ensures full security of user information and experience through features like a simple admin interface, support, and other security protocols.
Pricing:
- Free: plan offers its users easy sign-up along with free & limited access to some basic tools.
- Individual: starts at $7.95.
- Team: starts at $6.67 per user (3 users minimum).
- Enterprise: can directly contact them to get a personalized quote.
Infogram
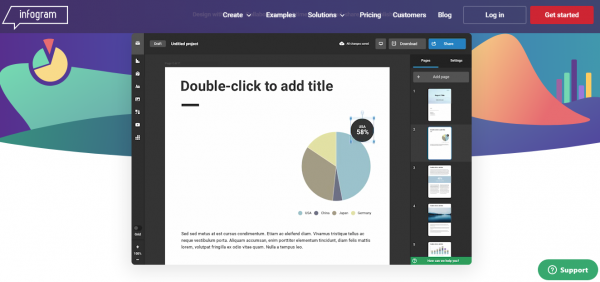
Infogram is one of the most popular and leading data visualization tools, where you can create engaging infographics and beautiful content in minutes. The platform offers specialized and effective visualization solutions for every type of business needs such as Marketing, Media, Education, Non-profit, Government, Reporting, Teams, and Enterprise.
You can create a wide range of content such as charts, infographics, reports, youtube thumbnails, social media posts, maps, and a lot more. Unlike other tools & software in the market, Infogram offers its users to create animated and interactive charts, maps, and others with the help of its object animations feature. Due to its quality tools, service, and perfection, it is used by 30,000+ leading companies worldwide.
Features:
- It provides users with both ready-to-use and customizable designs and templates.
- It is a perfect platform for real-time collaboration.
- It enables users to track their work and content with the help of its features like powerful analytics, evaluating interactivity, and creating custom links.
- It lets users publish their content online and optimize as per different platforms.
Pricing:
- Basic: plan offers users to use the platform free with limited access to tools and features for lifetime.
- Pro: at $19/ month when billed yearly.
- Business: at $67/ month when billed yearly.
- Team: at $149/ month when billed yearly.
- Enterprise: can directly contact them to get a personalized quote.
Drawio
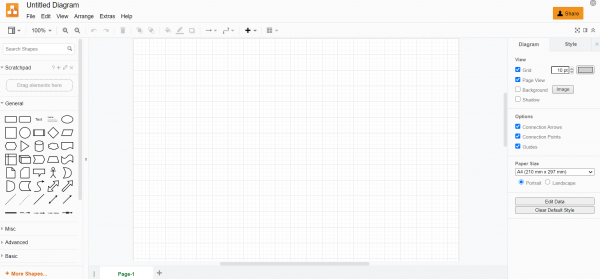
Just as the name of this tool suggests, Drawio is free on-the-web diagram software that helps you to draw your thoughts and ideas in the form of diagrams. Anyone with some basic understanding of such tools can easily make creative charts for their business with the help of its easy-to-understand options.
The first step to use the platform is to select a storage location from the option available for your diagrams. The platform will then provide you with a white sheet (in the middle) along with various options/tools (on the right, left, & top of the page) to draw different types of diagrams.
Features:
- The platform offers a very basic and user-friendly interface that enables anyone to create charts without any complexity or confusion.
- It offers a plain white sheet on which users can create, edit, or modify diagrams with the help of various options available.
- It provides different options to adjust shapes, diagrams, styles, sheet sizes, and many other options.
- It allows users to safely and securely share their documents via the web.
Pricing:
- Drwaio is a completely free platform where users get free chart-making tools to create diagrams freely. Tools and features offered by Drawio are not only free but also of good quality, effective, and impressive.
Related: Best Tools for Making Illustration Images
Venngage
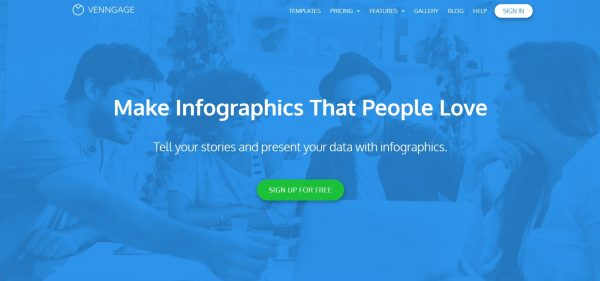
If you are looking for a tool to turn a lot of boring data into stunning charts and visualizations, then Venngage is the right platform for you. It has over 25+ features & tools that allows users to create visuals as per their needs such as Infographics, Charts, Graphs, Newsletters, Presentations, Brochures, Resume, and a lot more.
It covers almost all the aspects and requirements of data visualizations. It is the perfect data visualization tool as it has specialized features for different types of needs such as for Business, Premium, Education, Non-profit organizations, etc. Venngage is also preferred by over 21K+ leading businesses all over the world.
Features:
- It offers users the to select from hundreds of chart styles, maps, and icons such as Line chart, Summary chart, Bubble chart, Pie chart, Bar chart, and many more.
- Users can convert their data into visualizations as per their choice with the help of features like thousands of icons, pictograms, illustrations, customizable templates & themes, drag & drop feature, free-form canvas design, etc.
- It offers a 3-step easy infographics creation.
- The platform offers its users 24/7 customer support and a 1-1 consultation service.
Pricing:
- Free: offers easy & free sign-up in which users get limited access to some basic tools.
- Business: at $49/ month.
- Premium: at $19/ month.
- Education: at $29/ month and $99/ year. Both plans include a 14-day free trial.
- Non-Profit: starts at $10/ month and users get flat 50% off and can also request code for their non-profit.
Creately
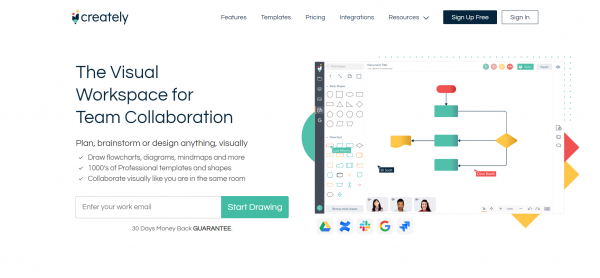
Just as the name of this tool suggests, Creately is the perfect workspace for planning, brainstorming, designing, and creating anything visually. Create is used by over 4 million people and used by thousands of top leading companies in the world.
The platform is known for providing specialized solutions and data visualizations for Marketing, Product, Engineering, HR & Operations, Strategy & Planning, and Education Teams. From business diagramming to technical diagramming, Creately offers its users to create a wide range of diagrams and visuals.
Features:
- Users can draw anything faster than anywhere else, with the help of its 1000+ smart shapes, easy shortcuts, pre-defined themes & styles, 70 diagram types, extensible library, etc.
- It is a perfect platform for real-time collaboration with anyone and anywhere as it offers collaboration features such as comments, actions, export, share, etc.
- It offers 50+ specialized shape libraries.
- It offers a 30-days money-back guarantee for all its plans.
Pricing:
- Free: plan offers to sign-up free and gives limited access to some basic tools.
- Personal: at $4.95/ month when billed annually.
- Teams: at $18/ month when billed annually.
- Enterprise: can directly contact Creately to get a personalized quote.
Canva
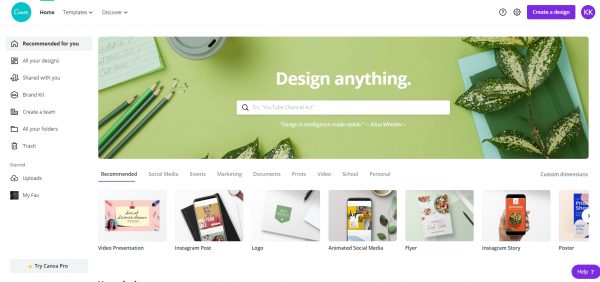
Canva one of the most popular easy-to-use and free designing platforms. You can create professionals designs with the help of a wide range of templates and design options available on the platform.
It offers specialized templates for Social Media, Personal, Business, Marketing, Education, etc. One can design and create presentations, videos, social media posts, graphs, charts, cards, reports, posters, and a lot more at Canva. Unlike other tools, users can create creative charts in a simple and less time-consuming manner.
Features:
- It offers many different types of charts and professionally-designed templates for the users to choose from and create charts of their choice.
- It involves no complicated software and, therefore, allows users to visualize their data simply and easily.
- Users can easily download, print, or share their documents.
- It has the drag-and-drop feature and also allows easy embedding of graphs & charts in presentations.
Pricing:
- Free: plan provides users with limited access to all the beginner tools required to start designing.
- Pro: starts at $12.95/ month for up to 5 persons.
- Enterprise: starts at $30/ month per person.
Smartdraw
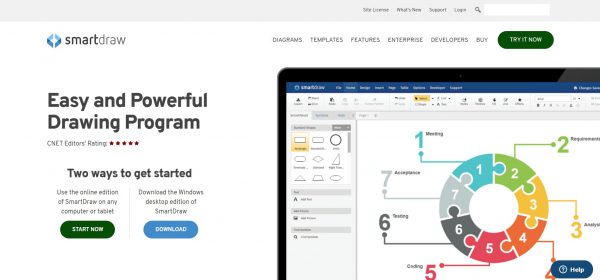
Smartdraw is yet another popular tool for easy and powerful diagramming. It is one of the best software for making a flowchart, organizational charts, a drawing program, and creating floor plans. Anyone willing to use Smartdraw can use either its online version through any device or can download its Windows desktop edition.
Smartdraw is easier to use than Visio and is the only alternative to Visio. It is also more powerful and easy-to-use than the drawing tools included in platforms like Google charts, Microsoft, etc. As a result, it is used by many leading companies in the world like Pepsi, JPL, FedEx, SAP, Nestle, etc.
Features:
- Users can create or edit visuals with the help of its intelligent formatting engine.
- It integrates with various tools such as AWS, Jira, Google, Office, etc.
- Users can get professional results with the help of over 34,000+ symbols and over 4,500+ templates.
Pricing:
- Single User: at $297 for a one-time purchase and requires no monthly or annual fees.
- Multiple Users: starts from $595 per year and billed annually for 5 users.
Chartblocks
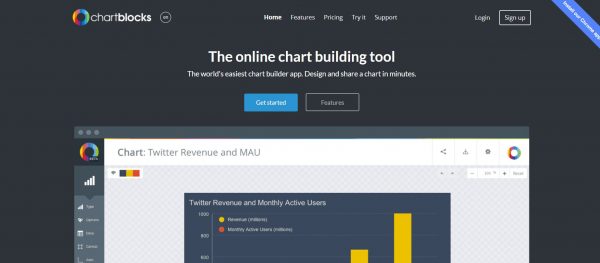
Chartblocks is the world’s easiest online chart building tool that lets everyone to design, create, and share charts in minutes. It is also one of the best chart making software and, therefore, thousands of users all over the world trust Chartblocks for making charts.
Making charts on the platform is very easy and simple as one does not require any coding or any complex understanding or any specialized knowledge to create charts. One just needs to follow three simple steps – import data, design as per needs, and start sharing it.
Features:
- It helps to import data from spreadsheets, via API, or type it manually. It also offers guidance throughout the import process and suggests necessary corrections for data.
- It offers users different types of charts and different variety of designs to customize charts as per choice.
- It helps users to create responsive charts.
- It allows easy sharing of carts to a website, Facebook, Twitter, and other social media sites.
Pricing:
- Personal: plan offers free sign-up and free access to limited tools.
- Professional: at $20/ month.
- Elite: at $65/ month.
Chartgo
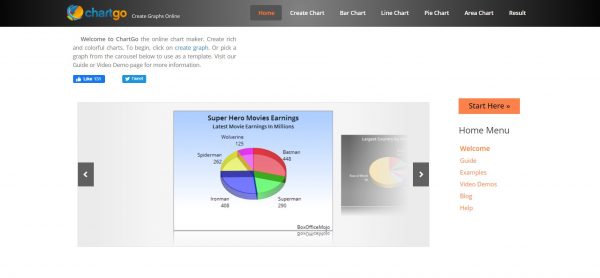
Chartgo is an easy-to-use online graph & chart making tool. One can select from the different types of charts on its home page such as Bar Chart, Line Chart, Pie Chart, Area Chart, etc.
The platform offers free chart-making tools that are simple to learn and easy to use. Users can create and share their charts in minutes or less simply by referring to the Guides and Video Demos offered by Chartgo. The platform aims to make the creation of charts simple as well as visually appealing.
Features:
- It allows users to generate a chart on the platform just by uploading their excel sheet containing the data.
- It allows users to generate a chart on the platform just by uploading their CSV file containing the data.
- Users can create any kind of investment charts on the platform.
Pricing:
- Chartgo is a completely free platform where users get free chart-making tools to create rich & colorful charts.
Related: Best Tools For Online Presentation
Conclusion
The above-list consists of some of the best chart-making tools available in the market. We’ve made sure that before selecting the right tool for your business, you get to try them first.
Therefore, most of the tools on our list have a free plan or offers a free trial and some of the tools are even completely free. The above-mentioned list also contains the features and pricing of the tools to make it easy for you to choose the right tool.