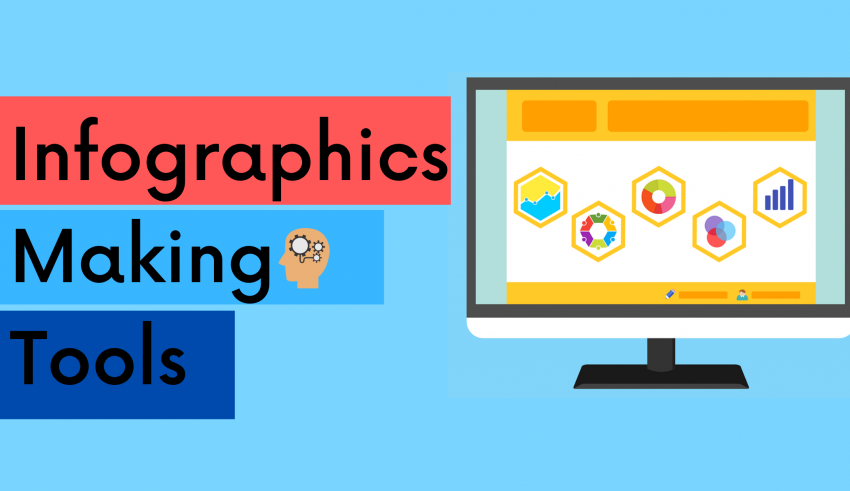
Infographics are a fun and unique way that effectively shares and displays information. As the name suggests, it is information depicted in the form of graphics. The main purpose behind using infographics is to convey important information in a fun and unique manner that ensures the retention of information in your audience.
With traditional methods of teaching, it gets very monotonous and students lose attention very quickly. Whereas, with infographics, it draws attention and forces the student to understand and digest the information. It has a bit of a learning curve, however, once you get over it, the results are stunning. Here are 12 tools that will help you create the most unique graphics ever.
Here are 10 tools that will help you create the most unique graphics ever:
Visme
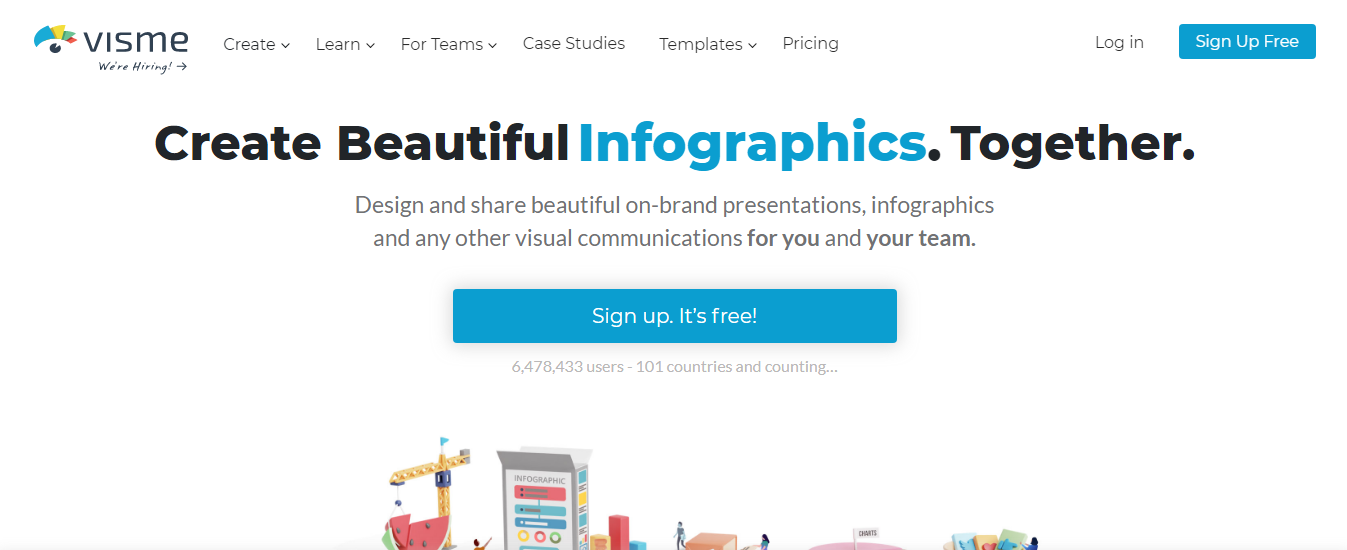
Visme is your best friend when it comes to visual art, infographics, and any designing that you would need. It is a cloud-based designing tool that is completely free! It enables you to work freely with your team and collaborate seamlessly without any third-party apps.
All you need to do is to sign up and then create away. After you have logged in with your account you will be able to view all the projects that you have created until now with this tool.
If you have not begun yet, simply tap on the create button to get started. Pick the type of project you would like to create, in this case, it would probably be an infographic.
You would then notice a few templates that are free for your use and others that require a paid, premium account. After choosing your template you can customize it however you want it to be with a variety of tools that already come with the tool. You can even add effects or animate objects inside the infographic.
The free plan does have a few good features to use but is very limiting. The standard paid version starts at $19 per month and the complete plan at $39 per month.
However, if you have a team of up to 3 members then it would cost you $117 per month. If you are a student you would have to pay $30 per semester and a teacher would pay $60 per semester. Overall, it is a great tool to use.
Canva
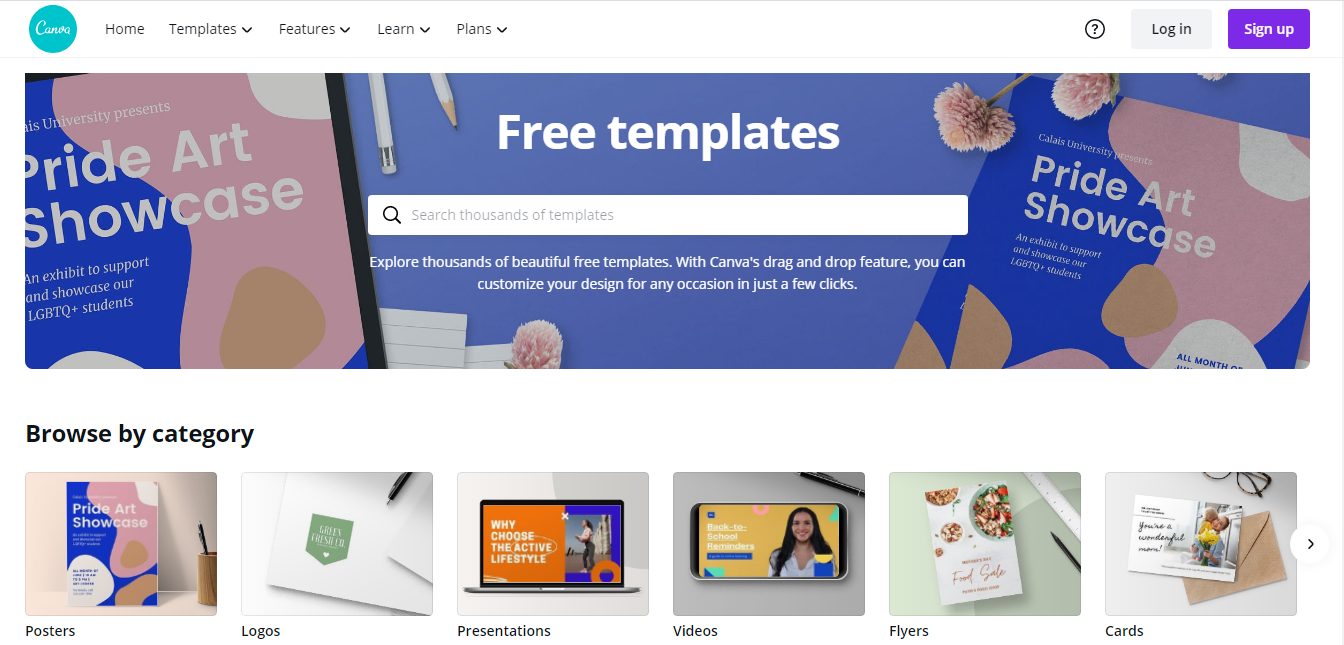
Canva is mostly free to use designing tool that is well-loved by people in all professions. Regardless of if you are a Graphic designer, social media marketer, architect, or even a business owner, there is something for you with Canva.
The best part about canva is that you need no prior design knowledge to work with it. Moreover, the tool is so well-known that you could probably find hundreds of videos on how to design using Canva.
It provides you with a huge range of templates that you can choose from based on your exact design need. It can be anything from birthday cards to social media banners to posters, ad graphics, infographics, and more. The options are endless.
You can choose from the variety of templates that are freely offered to you by Canva. After you have selected your template, you can choose from the vast library of elements to add to your design. Some are free to use and the other features need to be purchased. You can also choose to upload your images and add to them.
Canva is available to use for free. However certain features are locked. You can buy these tools using the Freemium purchases option that allows you to buy premium templates, images, icons, and more to give you that custom look. Additionally, you can use Canva for work at the price of $12.95 per team member, per month. It is a very versatile tool that is very handy and used by all.
Venngage
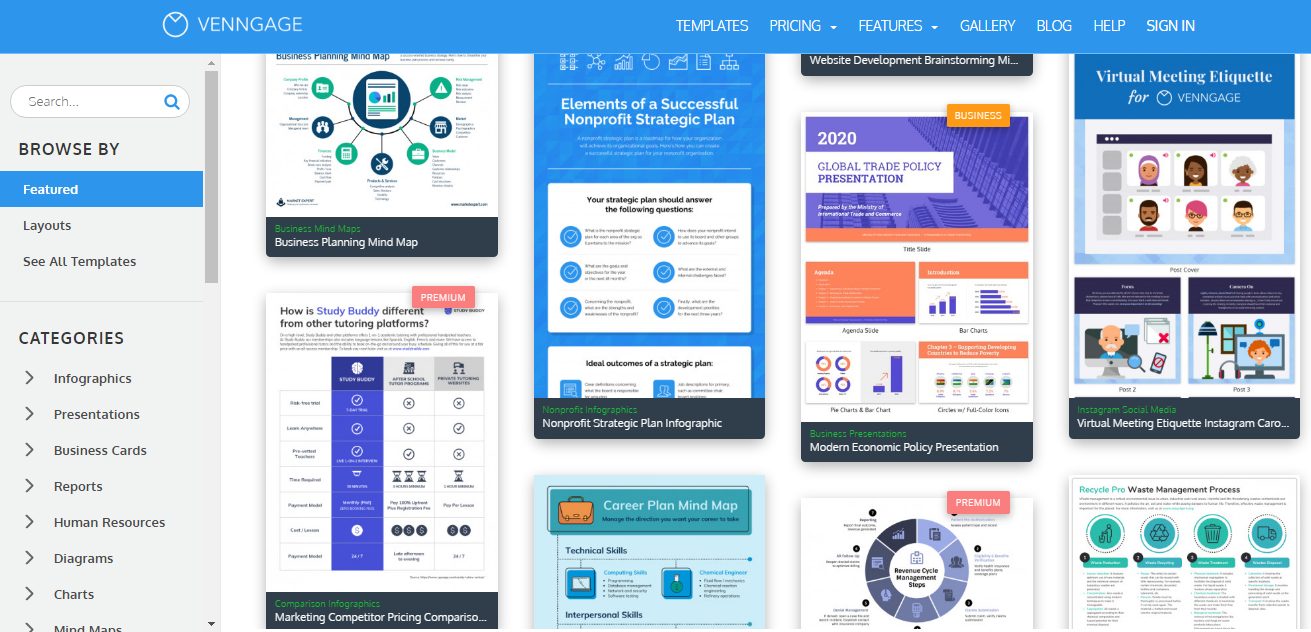
Venngage is similar to Canva but offers a few different options to pick from in terms of what you want to create. Venngage follows a simple three-step process that assures the best result for you.
All you need to do is to choose a template that interests you. Then you can add it whatever, charts, graphs and statistical information as you would like. These are just the two basic necessities to proceed with your design. Everything else is up to you to customize and design it based on your needs.
However, the templates for reports, posters, and infographics are fixed. The infographic section gives you a few more options to pick from that are topic specific like informational, timeline, charts, geographic, and more. Venngage also allows you to insert widgets, that include things like maps and charts that are based on the specific information and data that you have for your infographic.
Venngage is free for students and is a paid service for everyone else. The educational plan with 35 accounts for the whole class starts at $29 a month. The premium service for individuals starts at $19 per month, followed by $49 per month for businesses and organizations.
Non-profit organizations get 50% off all plans. Venngage does have a great gallery of ideas for design inspiration that is updated almost every day. Adding to which, it is an extremely easy tool to use with a minimum of 30 minutes required to create an engaging infographic.
Piktochart
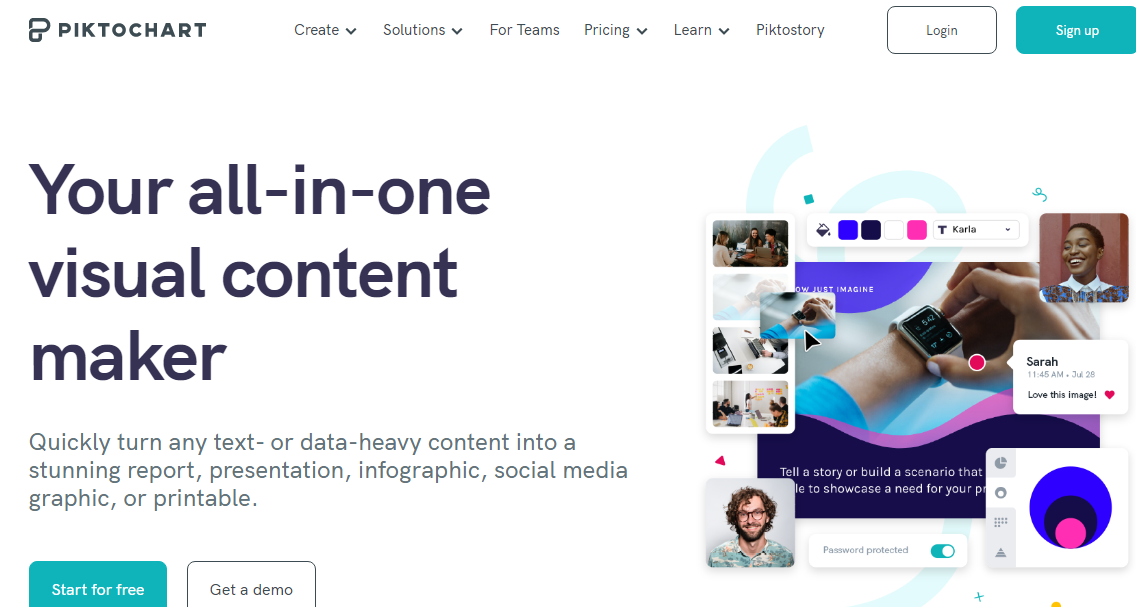
Piktochart is your all-in-one stop for all things infographics and presentations. It is a great tool to have on hand if you are a graphic designer. There are a lot of formats that you can choose from.
One of them is the traditional infographic size, a presentation size or even customize it to fit into where you want it too. You can choose to either create it on your own, choose one of the free templates or a paid one.
After selecting your template, you can simply drag and drop to add any graphic elements and texts to your canvas. Additionally, you can also choose to upload your images and completely customize it.
You can choose from the free, Lite, and Pro options. The free version does not have all the features that you would want to use, which is why it might be a good option to upgrade.
The Lite version costs $12.50 per month and the Pro costs $24.17 per month. Another paid version called Pro Team starts at $43.33 for two users per month. A non-profit organization can avail the service at $39.99 per year for individuals and $79.98 onwards for team plans.
Easel.ly
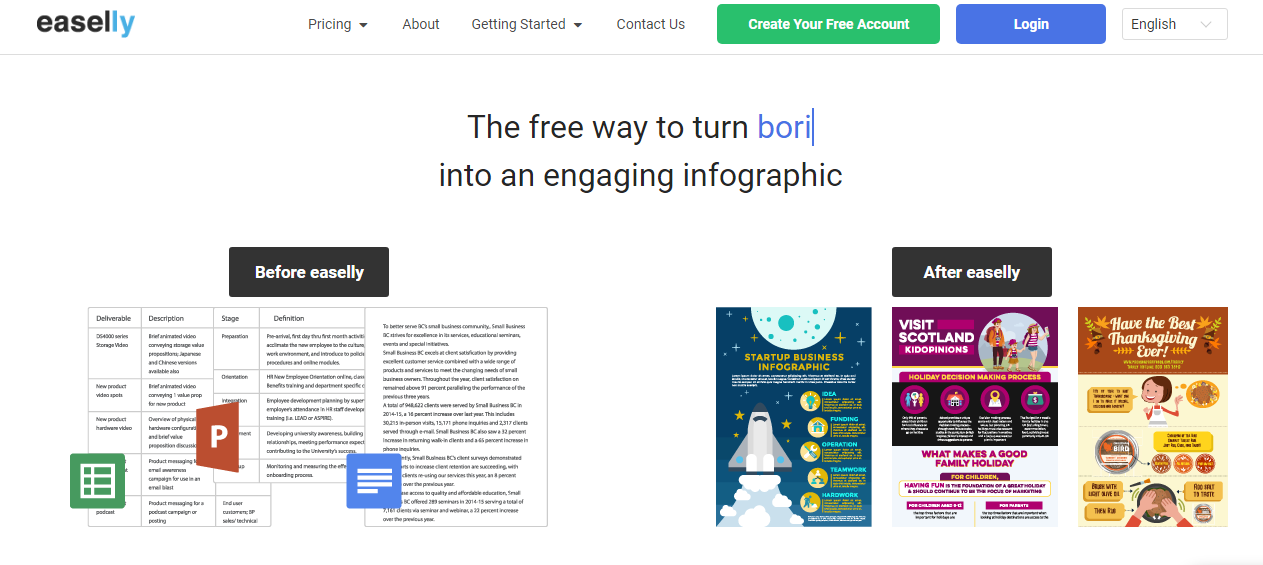
Easel.ly is your one-shop stop for creating engaging infographics. Turn your boring old tables of data into interesting bits of information that make your page seem more inviting.
The main page asks you to choose a template from the wide range that they offer. After you have decided which template you like, you will be directed to a new window where you can customize your infographic however you want. Easel.ly provides a variety of tools like shapes, texts, charts, backgrounds, and more.
You can use the free version for the majority of what you want to get done. If you want more features you can switch to the “Pro account at $4 per month. If you are a business owner or a non-profit organization, you will have to pay $5 per month.
For teachers, it is $4 per month and students get the upgrade at $2 per month. The pricing is very well worth it considering the features you get. One noteworthy feature is the free design sandbox that you can play around with even if you have not registered for the service. Easel.ly is an easy-to-use service that will give you quick results.
Infogram
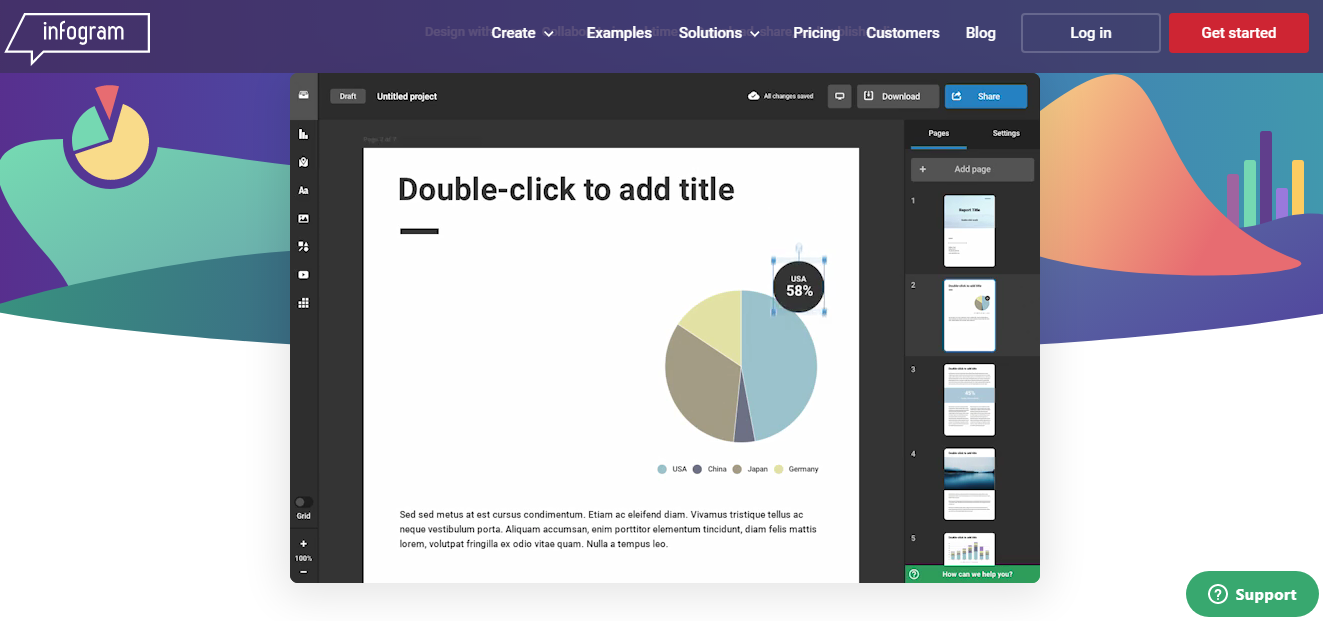
Infogram is specifically designed to help you create infographics, reports, and more. It is specifically designed to suit those working with a lot of numbers and data.
The vast array of data visualization tools helps your brand stay with its mission and vision. Not hindering your brand image, instead of enhancing it to make it better. The templates are aesthetically limited and if you are a free user your choices are even narrower. After you have picked out a template, you can edit the elements on it.
Infogram is your go-to tool for making infographics that rely heavily on data, numbers, charts, and graphs. There are both free and paid options. The Pro option is for $25 per month, whereas if you choose the business plan you would have to pay $79 per month.
If you are a team with 3 users, you would find yourself paying $170 per month. However, if you do have multiple teams starting with 10 users, you can talk to the Infogram for your quote.
It is worth the money to upgrade to the paid tools as it offers SQL connectors, link tracking, engagement analysis, and data analytics which no other competitor offers. You do require some basic skills to work around this tool.
Snappa
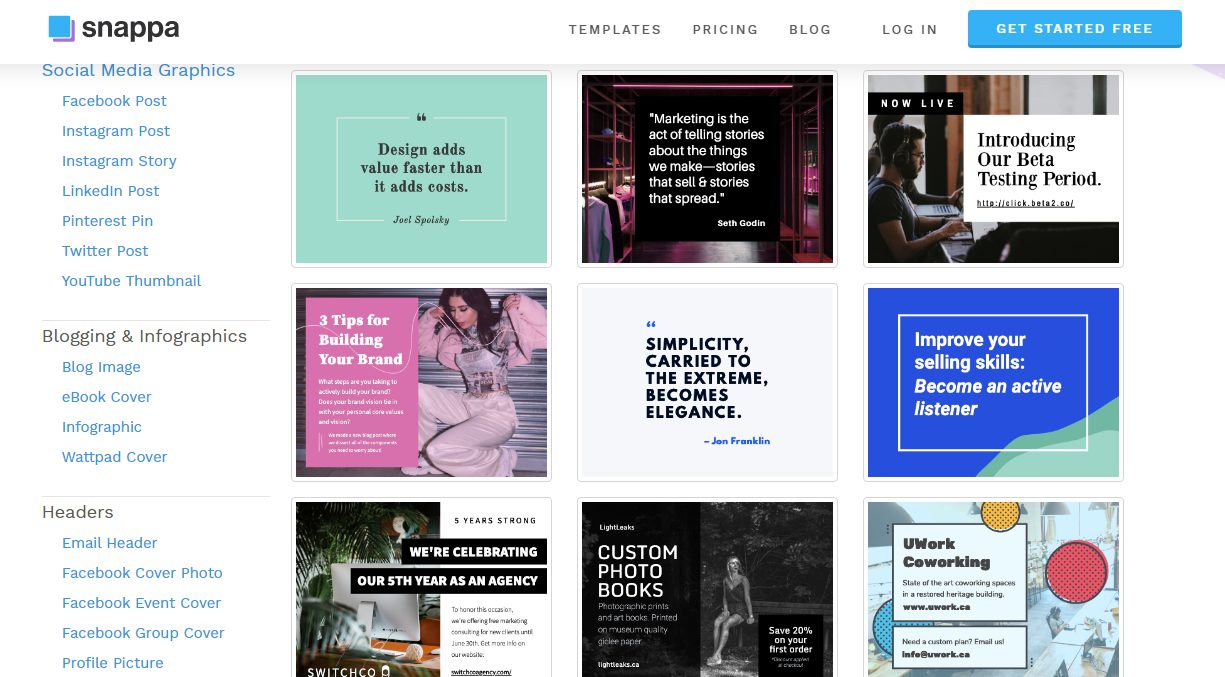
Snappa is the best time-saving, energy-efficient design tool that offers a lot of features in the free version. You don’t even need to start from the beginning as they do have a few features that are laid out for you to toggle with.
The only limitation to this tool is the number of downloads per month for free users. It allows new designers to create everything from social media content to infographics and even custom designs with a lot of pre-existing templates to choose from.
Combined with its vast library of free images, icons, and fonts, this tool is a great one to have. The paid versions start at $15 per user per month for the Pro version and $30 for 5 users per month. This tool is bound to shock you with so many free features available.
Animaker
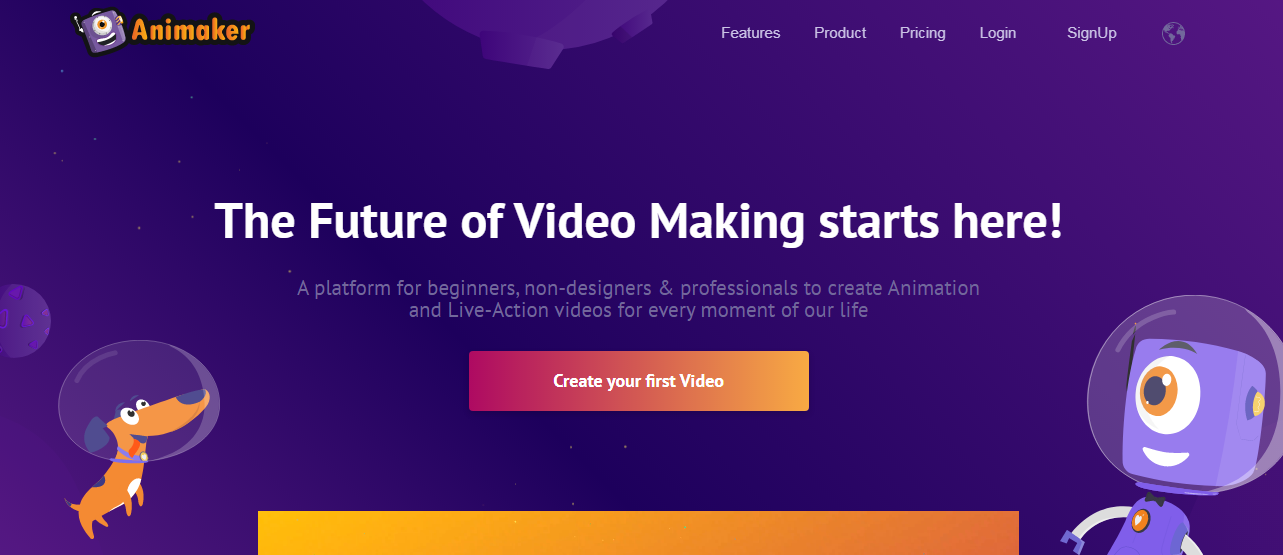
Animaker, as the name suggests is a tool that helps you create animated videos. How then did it make it on this list? Have you ever seen those videos with infographics like the pie charts that seemed to assemble itself in thin air?
Well, that is exactly what this tool helps you achieve. You can add animation to your infographics and create the best-looking infographics that are completely unique. Have a sales pitch? Throw them off with this amazingly easy to use an infographic maker and get that deal.
The tool comes with an in-built library of animated characters, images, and icons that users can pick and choose their story elements to build an infographic. It offers a variety of templates to use as the foundation for your infographic. Each template is essentially a video that is then dropped into the graphic editor to be customized for your needs.
The infographic itself is straightforward though it can be a little time-consuming. However, that is expected while working with a fully animated, video infographic. For someone who has never created a video before, there might be a bit of a learning curve.
But there are a lot of tutorials that help make this process easier. The free version is great, but it does not have all the features. The Personal paid plan is at $19 per month and the Startup $35 per month. The business plan is more expensive, of course, at $59 per month.
BeFunky
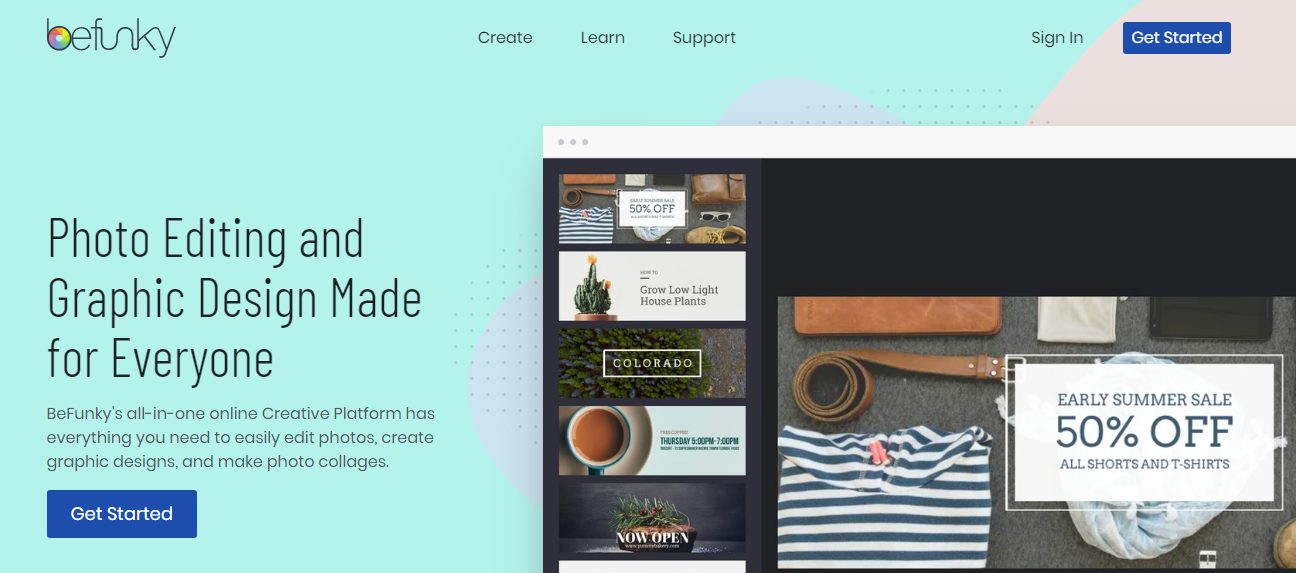
BeFunky is specifically designed for amateur designers to achieve that professional-looking infographic. You can edit photos, create collages, and achieve that good-looking graphic design professional-looking infographics. The photo editor is a collection of all the good features in a multitude of apps all brought to you in one place. Their graphic designing tool is not any less of a breeze to work with. Since it is targeted at beginners, the tool is very easy to work with.
The infographic maker is a part of their design package and uses the same drag and drop interface as the rest of the software. You only get one free infographic template that makes the tool very limiting for the free users. However, if you choose to upgrade to the premium plan it offers a much wider variety of templates with the BeFunky Plan.
The tool also has a built-in connection with Pixabay, Unsplash that gives you unlimited access to copyright-free images that could add a lot of character to your infographic. As you know now the free plan is very limiting. The paid plan provides you with all the features at $6.99 per month.
Biteable
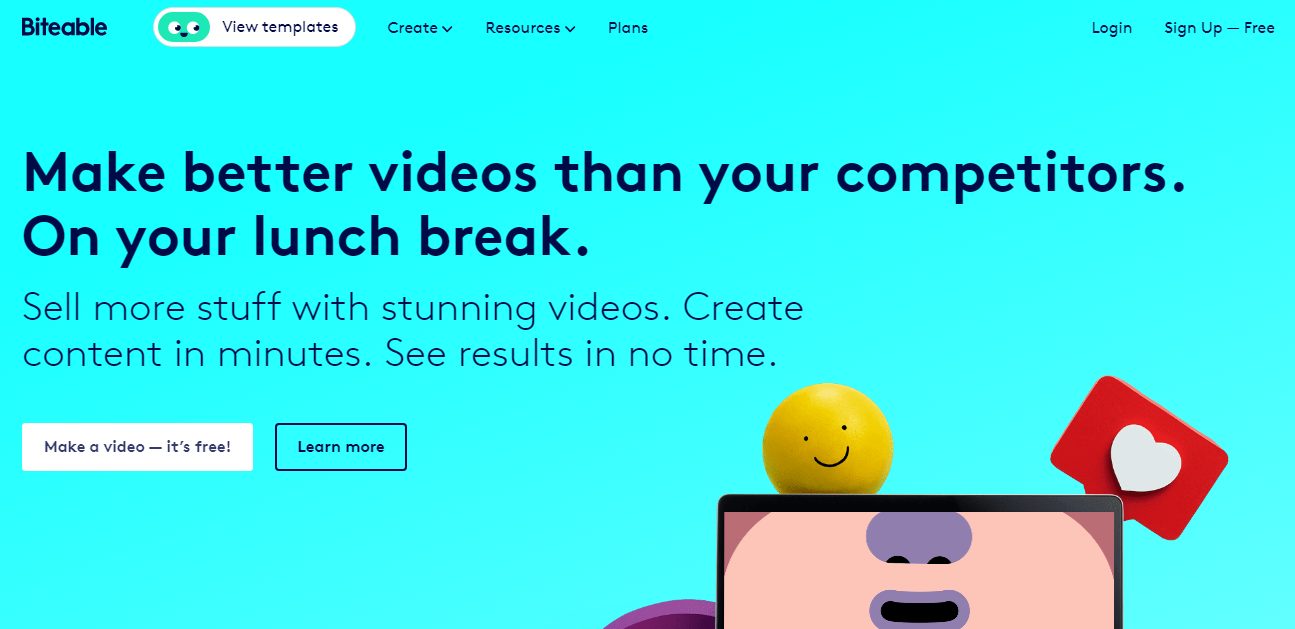
Biteable is similar to Animaker, except it allows you to produce high-quality videos with real-life humans in them. Keep in mind that this tool is completely free. Though it is extremely versatile in terms of video making, creating your infographic ain’t any less of a hassle. You can build convincing and attractive looking video infographics using this tool.
It comes with a variety of infographic video templates that you can choose from to edit. Along with which they have tons of stock footage, fonts, icons, and more that allows you to design your video on Biteable within a few minutes.
Free users can also publish their custom infographic videos directly to YouTube or Facebook. However, you need the paid plan to download your videos and store them on your Biteable account. The paid option is $29 per month that gives you the video-making feature as well. It is very easy to use and does not take more than 30 minutes to create a fairly good-looking infographic.
Mind the Graph
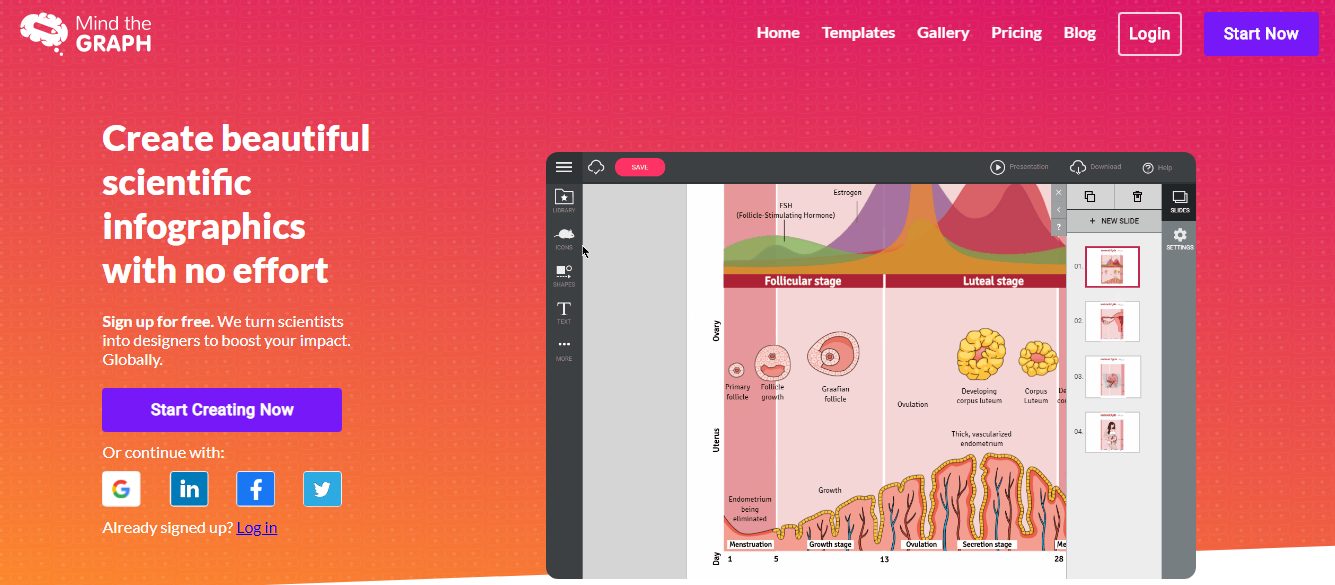
Mind the Graph is an infographic designing tool that was made with research scholars in mind. Often, compiling those huge amounts of data into a cohesive, comprehensive graph is simply uninteresting.
Mind the Graph helps add in some spice and fun into otherwise boring presentations. The tool provides over 3,000 scientific illustrations and customizable infographic layouts. It helps create presentations of the highest quality ever. There is no other tool on the market that gives you the ability to include illustrations like those of amoebas, bacteria, and molecules.
The basic free plan without any free templates offers a few levels of customization that gets the job done. However, for more intense customization it is recommended that you upgrade to the premium version. The paid version costs $5 per month for a student and $9 per month for a researcher. Additionally, it is also easy to use and requires no rocket science to figure it out.
Vizualize.me
Vizualize.me is a very unique type of infographic maker. It allows you to create an infographic resume. It is very untraditional in its very essence. All you have to do is login and start creating your resume as you would on a normal word document.
Moreover, you also have the option to connect to LinkedIn to populate some of the information automatically. You can try their full list of brand building tools from social media connections to everything else allowing brands to grow their awareness, engagement, and thereby boost sales. It is like a graphic creative enhancer of yourself in the form of an infographic.
Vizualize.me is a completely free tool that has all its features out for you to try at no special cost, whatsoever! It is completely easy to use and makes for an interesting and outstanding resume.
Conclusion
With this extensive list of tools, hopefully, you would have found your ideal infographic maker that suits your needs. While most infographic tools function on the same basic functionalities, they start to get diversified when you think about the sub-categories and their purposes.
Do experiment with different tools before you commit to one and decide to splurge your money on that. Most companies do not offer refunds.